QGIS Graphical User Interface..
Quantum GIS mempunyai Graphical User Interface (GUI) yang mesra pengguna. Namun, jika kita kenal QGIS, maka tak cinta..
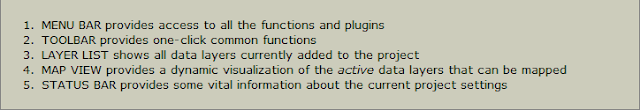
Interface QGIS terbahagi kepada 5 elemen iaitu :

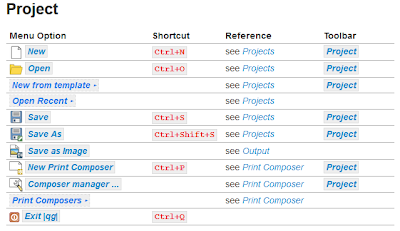
1. BAR MENU
Berikut adalah semua tool / Submenu yang ada dalam BAR MENU :-


3. MAP LEGEND / LAYER LIST
Interface QGIS terbahagi kepada 5 elemen iaitu :

1. BAR MENU
Bar menu menyediakan akses kepada pelbagai fungsi QGIS menggunakan kebiasaan hierarki menu. Menu di atas dan ringkasan beberapa pilihan menu disenaraikan di paparan bawah dengan ikon tool yang sama tertera pada toolbar, dan juga pintasan (Shortcut) papan kekunci. Pintasan papan kekunci juga boleh dikonfigurasikan secara manual, dengan menggunakan [Konfigurasi Pintasan] tool di bawah menu 'SETTING'.
Toolbar yang mengandungi tool akan disenaraikan selepas setiap pilihan menu di tick hasil klik kanan pada toolbar tersebut. Tambahan lagi, sesetengah pilihan menu hanya muncul jika plugin yang sepadan dimuat turun. Untuk maklumat lanjut mengenai alat dan toolbar, lihat bahagian Toolbar.
Toolbar yang mengandungi tool akan disenaraikan selepas setiap pilihan menu di tick hasil klik kanan pada toolbar tersebut. Tambahan lagi, sesetengah pilihan menu hanya muncul jika plugin yang sepadan dimuat turun. Untuk maklumat lanjut mengenai alat dan toolbar, lihat bahagian Toolbar.
Berikut adalah semua tool / Submenu yang ada dalam BAR MENU :-

Setiap .shp, data shapefile, apabila aktifkan button 'TOGGLE EDITING' , button add features lain akan kelihatan.


Apabila memulakan penggunaan QGIS, tidak semua plugin dipasang. Oleh itu, pengguna perlu pilih button Manager and Install Plugins untuk mencari plugin yang berkaitan dengan tugas/kerja semasa.


2. TOOLBARS
Bar alat menyediakan akses kepada kebanyakan fungsi yang sama seperti menu, ditambah lagi dengan alat tambahan untuk berinteraksi dengan peta. Setiap perkara mempunyai toolbar pop timbul bantuan yang ada. Tetikus anda ke atas item dan penerangan ringkas tujuan alat ini akan dipaparkan.
Setiap bar menu boleh digerakkan mengikut keperluan anda. Selain itu setiap bar menu boleh dimatikan menggunakan tetikus menu konteks kanan butang anda memegang tetikus di atas toolbar (baca juga Panel dan Toolbars).
Setiap bar menu boleh digerakkan mengikut keperluan anda. Selain itu setiap bar menu boleh dimatikan menggunakan tetikus menu konteks kanan butang anda memegang tetikus di atas toolbar (baca juga Panel dan Toolbars).
3. MAP LEGEND / LAYER LIST
Jadual petunjuk (Map Legend / Layer List) di sebelah petak kiri QGIS menyenaraikan setiap layer data spatial yang dipaparkan. Checkbox di setiap layer boleh digunakan untuk show atau hide layer tersebut. Selain itu, layer juga boleh dipilih dan disusun (up or down in the legend to change the
z-ordering. Z-ordering means that layers listed nearer the top of the legend are
drawn over layers listed lower down in the legend ).
Note :
This behaviours can be overridden by ‘Layer order’ panel.
Layers in the legend window can be organised into groups. There are two ways to do so:
Right click in the legend window and choose Add Group. Type in a name for the group and press Enter. Now click on an existing layer and drag it onto the group.
Select some layers, right click in the legend window and choose Group Selected. The selected layers will automatically be placed in a new group.
To bring a layer out of a group you can drag it out, or right click on it and choose Make to toplevel item. Groups can be nested inside other groups.
The checkbox for a group will show or hide all the layers in the group with one click.
The content of the right mouse button context menu depends on whether the selected legend item is a raster or a vector layer. For GRASS vector layers
Toggle editing is not available. See section Digitizing and editing a GRASS vector layer for information on editing GRASS vector layers.
Menu Klik Kanan Mouse untuk Data-Data Raster
- Zoom to layer extent
- Zoom to Best Scale (100%)
- Stretch Using Current Extent
- Show in overview
- Remove
- Duplicate
- Set Layer CRS
- Set Project CRS from Layer
- Save as ...
- Properties
- Rename
- Copy Style
- Add New Group
- Expand all
- Collapse all
- Update Drawing Order
Tambahan, mengikut posisi dan pilihan layer.
- Make to toplevel item
- Group Selected
Menu Klik Kanan Mouse untuk Data-Data VektorTambahan, mengikut posisi dan pilihan layer.
- Zoom to Layer Extent
- Show in Overview
- Remove
- Duplicate
- Set Layer CRS
- Set Project CRS from Layer
- Open Attribute Table
- Toggle Editing (not available for GRASS layers)
- Save As ...
- Save Selection As
- Filter
- Show Feature Count
- Properties
- Rename
- Copy Style
- Add New Group
- Expand all
- Collapse all
- Update Drawing Order
- Group Selected
Menu Klik Kanan Mouse untuk Group Layer
- Zoom to Group
- Remove
- Set Group CRS
- Rename
- Add New Group
- Expand all
- Collapse all
- Update Drawing Order
Pemilihan (Select) layer dalam satu masa boleh dilakukan dengan button ctrl + selecting the layers with the
left mouse button. Anda juga boleh menggerakan semua layer yang dipilih ke dalam group layer baru secara serentak. Layer ataupun group layer juga boleh dibuang serentak dgn button ctrl + D.
Working with the Legend independent layer order
There is a widget that allows to define a legend independent drawing order. You can activate it in the menu Settings ‣ Panels ‣ Layer order. Determine the drawing order of the layers in the map view here. Doing so makes it possible to order your layers in order of importance, for example, but to still display them in the correct order (see figure_layer_order). Checking the
Control rendering order box underneath the list of layers will cause a revert to default behavior.
Figure Layer Order:

Define a legend independent layer order

4. MAP VIEW
Inilah produk utama/ hasil akhir dalam QGIS dimana data spatial yang terhasil dipaparkan di kawasan ini. Peta yang terhasil adalah berpandukan data vektor dan raster yang telah dipilih. Map view boleh digerakkan atau panned (shifting the focus of the map display
to another region) serta zoom in dan zoom out. Pelbagai operasi boleh dilakukan dengan menggunakan toolbar diatas. Map View adalah berkait rapat dengan Map Legend. Apa yang dipaparkan di senarai layer / Map Legend, itulah paparan di Map View.
Tip
Zooming the Map with the Mouse Wheel
You can use the mouse wheel to zoom in and out on the map. Place the mouse cursor inside the map area and roll the wheel forward (away from you) to zoom in and backwards (towards you) to zoom out. The mouse cursor position is the center where the zoom occurs. You can customize the behavior of the mouse wheel zoom using the Map tools menu under the Settings ‣ Options menu.
Tip
Panning the Map with the Arrow Keys and Space Bar
You can use the arrow keys to pan in the map. Place the mouse cursor inside the map area and click on the right arrow key to pan East, left arrow key to pan West, up arrow key to pan North and down arrow key to pan South. You can also pan the map using the space bar or the click on mouse wheel: just move the mouse while holding down space bar or click on mouse wheel.
5. STATUS BAR
Status Bar menunjukkan posisi semasa layer mengikut Mouse pointer / Cursor berdasarkan projection / koordinat yang dipilih.
To the left of the coordinate display in the status bar is a small button that will toggle between showing coordinate position or the view extents of the map view as you pan and zoom in and out.
Bersebelahan paparan koordinat ialah paparan skala ketika itu. Walaupun zoom in mahupun zoom out, QGIS akan menunjukkan skala semasa itu. Skala yang dibenarkan adalah 1:500 sehingga 1:1000000.
Tip
A progress bar in the status bar shows progress of rendering as each layer is drawn to the map view. In some cases, such as the gathering of statistics in raster layers, the progress bar will be used to show the status of lengthy operations.
If a new plugin or a plugin update is available, you will see a message at the far left of the status bar. On the right side of the status bar is a small checkbox which can be used to temporarily prevent layers being rendered to the map view (see Section Rendering below). The icon
immediately stops the current map rendering process.
To the right of the render functions you find the EPSG code of the current project CRS and a projector icon. Clicking on this opens the projection properties for the current project.
Calculating the correct Scale of your Map Canvas
When you start QGIS, degrees is the default unit, and it tells QGIS that any coordinate in your layer is in degrees. To get correct scale values, you can either change this to meter manually in the General tab under Settings ‣ Project Properties or you can select a project Coordinate Reference System (CRS) clicking on the
CRS status icon in the lower right-hand corner of the statusbar. In the last case, the units are set to what the project projection specifies, e.g. ‘+units=m’.
Berikut adalah pautan yang mungkin berguna untuk tutorial lebih mengenai penerangan QGIS.
Semoga Berjaya!

Comments